1- Studying the global electric car market and its trends
The automobile industry, as Peter Drucker called it “the industry of industries“, is composed of knowledge, science and technology, which is mixed with creativity, innovation and art.
In terms of its close connection with people’s daily life and the high volume of capital, employment and turnover, the automobile industry is the interest and competition of countries, companies and large capitals. It drives industrial economic sectors.
A car is one of the products that consists of a relatively large number of intermediate assemblies, parts and raw materials.
As a result, the industries related to the manufacture of these components have a very wide range (including metal industries, textiles, chemicals and paints, electricity and electronics, etc.). At On Takes.
A car is a collection of thousands of small and large parts, the production of each of which requires technical knowledge, skills and necessary hardware.
Collecting and assembling these parts at the right time with the right price and quantity is a great art that requires a long-term plan and the determination of a suitable strategy in addition to the need for technical knowledge and management ability.
The automobile industry in the world is an assembly industry where the automobile factory buys most of the parts it needs and assembles the final product in the factory.
The more car parts and the more people/hours required for assembly (such as heavy cars), the more added value it brings.
Stay with act group to explore more global electric car market in this article.
Read More : What is the best international ( imported ) selling car in Iran
1-1- Car market and its trends
In proportion to the increase in the world’s population, as well as economic growth and improvement in recent years, especially in developing countries and up-to-date with new economic powers and the efforts of the world’s top car manufacturers in providing affordable cars, the increasing trend of car demand in recent years can be seen and predicted. This trend may continue in the coming decades.
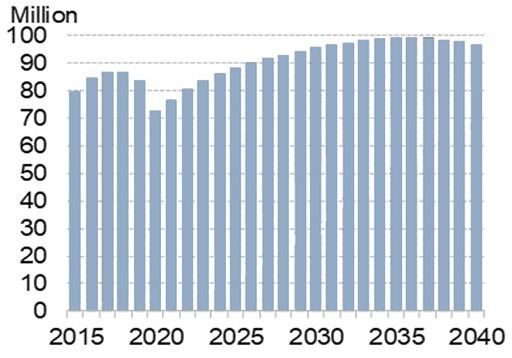
Figure 1-1: Forecast of annual global sales of passenger cars, source [1].
Following the covid-19 pandemic at the beginning of 2019 in East Asia and Europe and following it all over the world and the application of restrictions on citizenship and jobs in all parts of the world, the amount of car sales and production in 2019 and 2020 respectively by 3.5% and There was a 13% decrease.
Studies of the car industry and market show that the upward trend in car sales and demand will resume again, and this increase in sales is expected to reach 100 million cars in 2035 [2].
Read More : List of associations related to iran’s automotive industry
1-2- Global climate changes and global decisions and actions affecting the automotive industry
in the demand of industrialized countries for fossil energy sources, the process of producing greenhouse gases and CO2 gas in particular Increase impressive find did _ To so That Level release CO2 gas _ At Year 2019 has increased 9 times compared to the last 100 years (Figure 1-2).
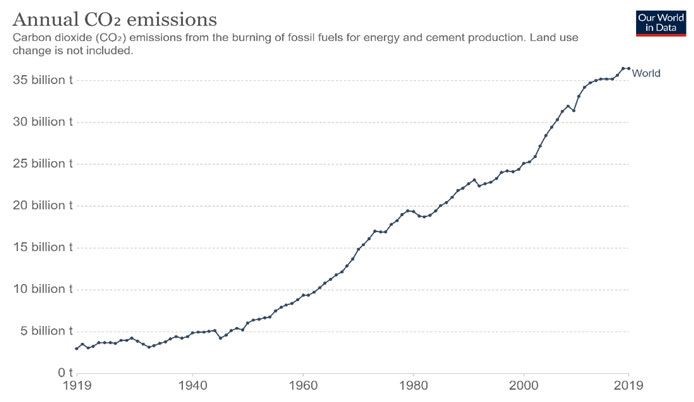
Figure 1-2: Annual amount of CO2 gas emissions At the world [3].
The results of recent decades’ studies on the effect of greenhouse gas emissions on global climate change have attracted the attention of scientists and rulers. The results of these studies show that the temperature of the earth’s surface can increase by 4.5 degrees Celsius in a pessimistic scenario [4].
Among the consequences of the temperature increase, we can mention the melting of the Arctic ice, the increase of the open water level and the flooding of some islands and beaches, the fires of forests and pastures, the destruction of wildlife, water and food shortages.
All these consequences along with other cases prompted the rulers to deal with these consequences by taking compensatory measures.
In this regard, in 2015, the representatives of the countries of the world gathered at the Paris Conference and under the Paris Agreement, they committed to take compensatory measures in order to reduce the emission of greenhouse gases.
During this treaty, 5 major goals were considered for compensatory measures of industrialized countries [5].
- The average increase in global temperature should be kept at 2 degrees Celsius
- The increase in global temperature should be limited to 1.5 degrees Celsius
- Preservation and increase of forest areas in view of absorption of atmospheric greenhouse gases
- Alignment and compatibility of investments with the goals of the Paris Agreement
- Increasing ability to adapt to climate change
The annual evaluations of the UN commissions and energy and financial institutions of countries’ compensatory measures to reduce greenhouse gas emissions and their predictions of the extent to which the goals of the Paris Agreement will be achieved show that there will be different possible conditions for the world’s climate situation.
Based on this, several scenarios describing the possible futures of CO 2 gas emissions Is, Development Found Is That At Fig 1-3 is displayed.
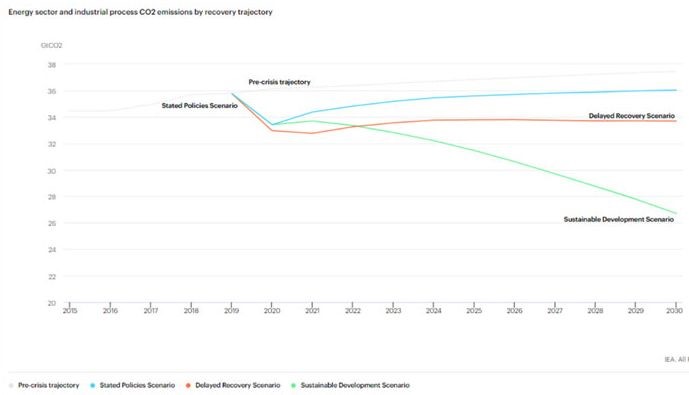
Figure 1-3: Forecasting the amount of CO 2 gas emissions until the Year 2030 based on different scenarios by the International Energy Agency
the Paris Agreement in 2017, countries in line with the goals of reducing CO2 emissions To the face Voluntarily goals particle for direct object To self At Opinion they got.
this Goals To Contributions determination done It is called nations (1). By summarizing these goals and examining the actions of the countries, the scenario of announced policies (2) was introduced.
By studying and examining this scenario, it is predicted that not only until the year 2070, the amount of CO 2 emissions will increase To Zero does not reach But Only intensity Growth release yearly CO2 gas _ decreased will be And this Indicator To Process Face To Growth self Continuation Will gave (Fig 1-3).
Studies on the reduction of CO2 emissions To Purpose realization Goals treaty Paris leading To Introduction scenario Development became stable (3); during this scenario Pure Level release CO2 gas _ At It should be 2070 To Zero inclined [6] scenario Development Stable Contains Actions hard catchy Oh you may to be That Countrys With The higher the amount of CO2 gas emissions particle for direct object committed To do actions slow That until the Target limited to do medium Increase temperature of level Butter the earth To 2 degrees Celsius to be achieved.
The evaluations of the countries’ progress towards the sustainable development scenario in 2020 and 2021 show that this movement is very slow and incomplete, and in this limited time, large and extensive changes are needed in the goal setting, policies and actions of the countries.
By joining the Paris Agreement, Iran has voluntarily joined in order to cooperate in improving the climate of the planet with the goals of reducing CO2 emissions. committed done is [7].
- 4% reduction in greenhouse gas emissions by 2030 for sure
- 8% reduction in greenhouse gas emissions until 2030 on a conditional basis
1-2-1- The contribution of the transportation industry in the emission of CO 2 gas
The world’s transportation industry, including the air, sea, road and rail transportation sectors, due to the high consumption of fossil fuels, is an important contributor to the emission of greenhouse gases, especially CO2 gas. has it.
Statistics global From Sections Different Economic sign Gives next From the part Production Energy (electricity And thermal), the part carry And quote the most share release CO2 gas year-At the world particle for direct object Dara Is.
Figure 1-4 shows may to give at 2016 from 35 billion _Ton CO2 gas_ publish done At atmosphere the earth share the parts Production Energy and carry and quote To order about 15 and 8 billion Ton Been Is That equivalent to 43% and 23% of the total release CO2 gas-Is.
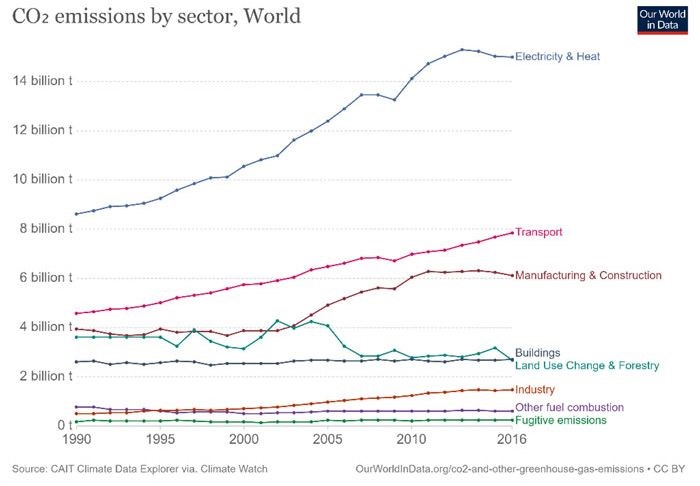
Figure 1-4: Annual amount of CO2 gas emissions At the world On according to Sections Various [8].
the transportation industry in CO2 emissions sign From Importance optimal making And Or change Paradigm Consumption fuel At industry carry And quote may be-tip Oh you That Necessary To Mention Is 73 % share carry And quote Road Oh you From release CO2 gas-at the part carry And quote Is.
To This the reason At Countrys Development Found And Countrys at now Development From Tool Rules And Standards hard catchy To Purpose realization Goals Decrease release gas greenhouse Oh you With Source carry And quote Interest They take.
also With Development Technologys Equipment vehicle Electricity and their price reduction has provided a suitable platform for governments to support the change of fuel consumption paradigm from fossil fuel to electricity in the transportation sector.
Figure 1-5 shows the goals of European and East Asian countries in supporting the development of the global electric car market and banning the sale of internal combustion vehicles in the transportation sector.
As can be seen in the figure, the mentioned countries are trying to make 100% of the sales of new products of zero-emission cars by 2040; And they have committed to zero emissions by 2050. In other words, only electric cars should have a share in the road transport fleet and combustion cars should be removed from the roads.
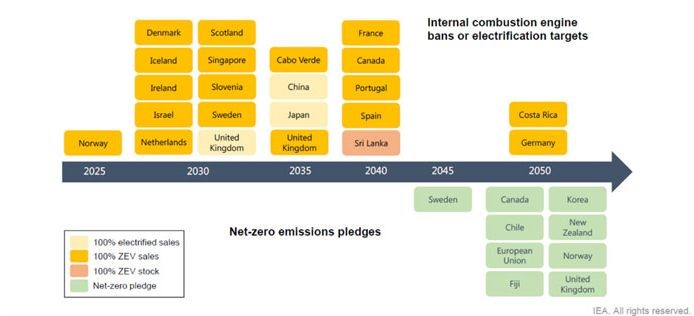
Figure 1-5: Countries’ goals in electrifying cars or banning internal combustion cars in order to reduce CO2 emissions the part carry And quote [2]
1-3- Study of the global electric car market in the world
In 2020, due to the outbreak of the Corona disease for the second year in a row around the world and the decline in global car production and sales, due to the investments made in the development of the electric car industry, the development of this type of car market had a visible jump.
So that in 2020, the registry of electric cars has grown by 41%. And the share of electric car sales in the world car market increased by 4.6%. This increase in the sales share has been achieved by providing more than 360 models of electric cars from leading car manufacturers in the world.
Among the big electric car markets in the world, the two markets of China and the European Union with the highest amount of sales are leading a tight competition.
In 2020, the European Union, by selling more than 1,300,000 electric cars, was able to break the sales record of about 1,200,000 electric cars in the Chinese market for the first time, and by doubling the amount of sales, it was the fastest growing compared to the previous year.
figure out Figure 1-6 shows the annual sales of electric cars in major markets between 2015 and 2020. As can be seen, China, America and the European Union have the largest markets for electric vehicles.
In the year In 2020, the share of electric cars in the three major markets of the European Union, China, and the United States has reached 10%, 6%, and 2%, respectively. In the European Union, the pioneering countries in the development of the global electric car market are Norway, Sweden, the Netherlands, Germany, France and England.
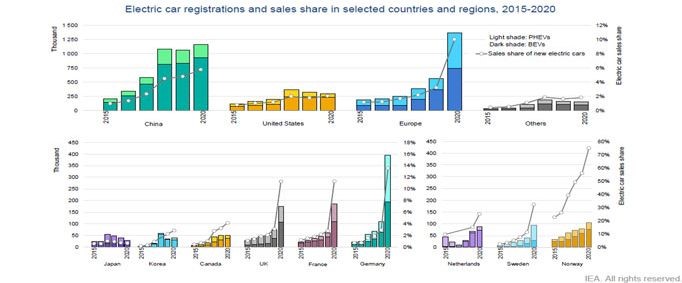
Figure 1-6: The rate of increase in the registration of electric cars in major markets in 2020 [2]
Since 2015, the development of the global electric car market in China and the European Union marked a leap in the global development of this market (Figure 1-7). In recent years, millions of electric cars of all-electric and plug-in hybrid types have been introduced to the market.
The trend of increasing the amount of electric cars has continued in recent years, and according to the investments made on the development of the electric car industry and market, the increasing trend is expected to continue in the coming years.
In 2020, it is estimated that there will be more than 10 million rechargeable electric cars on the world’s roads. This amount is equivalent to 0.8% of all cars in the world, which shows the initial steps of the development of electric car markets in the world.
It is expected that with the reduction in the price of electric cars due to mass production and the reduction in the price of battery packs and government support around the world, the speed of replacing internal combustion cars with new electric cars will increase significantly.
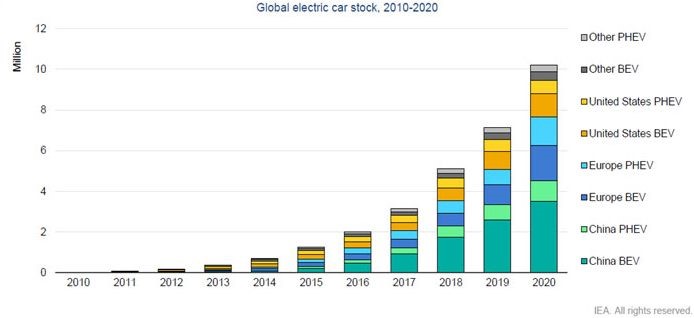
Figure 1-7: The number of rechargeable electric cars in the world based on major markets [2]
The purchase price of electric cars in 2020 is approaching the price of internal combustion cars, but they are still significantly different from each other from the point of view of customers. However, due to the simple structure of the electric drive, compared to the internal combustion drive, the operating and maintenance costs will be lower.
Several studies have been conducted on the comparison of the purchase, operation and maintenance costs of electric vehicles with internal combustion vehicles. In Table 1-1, this comparison is done by considering 6 criteria.
Table 1-1: Comparison table of electric car costs with internal combustion cars [9]
Row | Criterion | CRITERIA | electric car | Internal combustion vehicle |
1 | Maintenance cost (lifetime) | Lie-time Maintenance Cost | 4,600 Dollar | 9,200 Dollar |
2 | Fuel cost (over the lifetime) | Life-time Fuel Cost | 7,000 $ | 15,500 $ |
3 | The expenses of the first 7 years | Capital Cost and O&M Cost in 7 years | Less than the costs of the best-selling model and the best combustion car model in the same class | – |
4 | Operating costs (over the lifetime) | Life-time O&M | 10,000-6,000 Cheaper dollars | – |
5 | Second-hand car costs with 5 to 7 years of life | Used EVs | The economic savings of a 5-7-year- old electric car is 2-3 times more. | – |
6 | Car sales value after 7 years | Resale Value | 0.48-0.43 | 0.48-0.45 |
1-3-1- Electric vehicle batteries
The battery in electric cars is responsible for providing the energy source of the car’s engine. Depending on the type of electric vehicle, the number of battery cells and their energy density will be different.
Lithium-ion batteries are more used in electric vehicles due to their long life and higher energy density than the common battery technologies in the market. Lithium-ion batteries used in electric cars are cell (cylindrical) or plate type.
A battery pack is a collection of several battery cells or plates that are arranged together taking into account mechanical, thermal and electrical requirements. Battery packs provide electricity from tens to hundreds of kilowatt-hours. Several companies in the world have invested in the development of lithium-ion battery technology and battery packs.
As a pioneering company in the field of electric vehicles and especially battery packs, Tesla in America has invested in the development of battery pack technology for electric vehicles since 2003. This company, in cooperation with Panasonic, has been able to reduce the price of the battery pack from $1,200/kWh in 2010 to $180/kWh in 2021 (by 85%).
Studies on the trend of investment in technology development and battery pack production show that the battery pack price will approach $100/kWh by 2030 (Figure 1-2). And this figure is expected to reach $80/kWh. The consequence of this event will be a sharp decrease in the price of electric cars and its competitiveness.
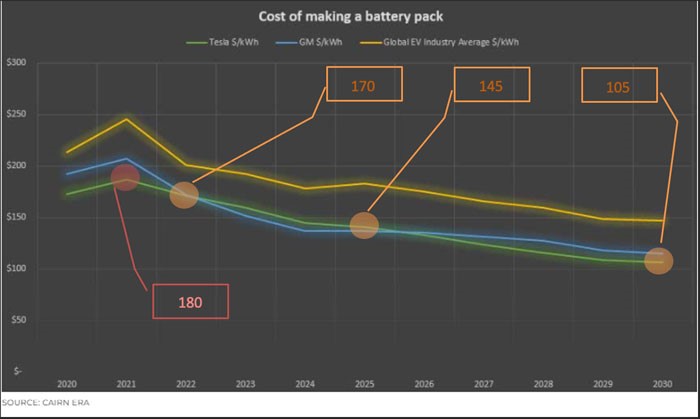
Figure 1-8: Price trend forecast ($/kWh) of electric car battery pack until 2030
At the same time as Panasonic, other major battery manufacturing companies have also invested in the development of technology and mass production of lithium-ion battery cells (Figure 2-2). These companies have taken charge of supplying batteries to electric car manufacturers by building battery factories-known as Giga Factory.
The total production capacity of lithium-ion battery manufacturing companies in 2020 is estimated to be 475 gigawatt-hours, with the seven largest companies in this industry supplying over 76% of the lithium-ion batteries produced to automakers.
The forecast of the development of global markets and the increase in sales of electric vehicles to the extent of approximately 30 million units in 2030 will be the driving factor for the demand for lithium-ion battery packs.
According to the announcement of major battery producing companies to invest in increasing the production capacity of automotive class lithium-ion batteries, it is expected that by 2030 the battery production capacity will be more than GWh will reach 2,800, assuming the average battery pack capacity of electric cars is 75 kWh, this amount of battery production in 2030 will meet the demand of more than 37 million all-electric cars of car manufacturers in the world [10].
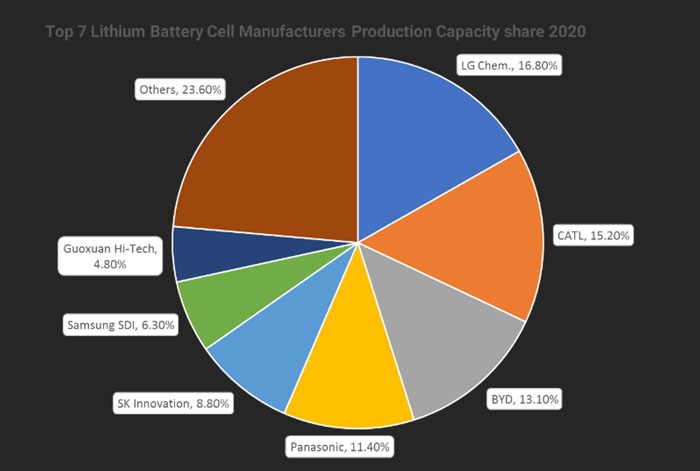
Figure 1-9: The share of the 7 largest automotive class lithium-ion battery manufacturers in the world in 2020
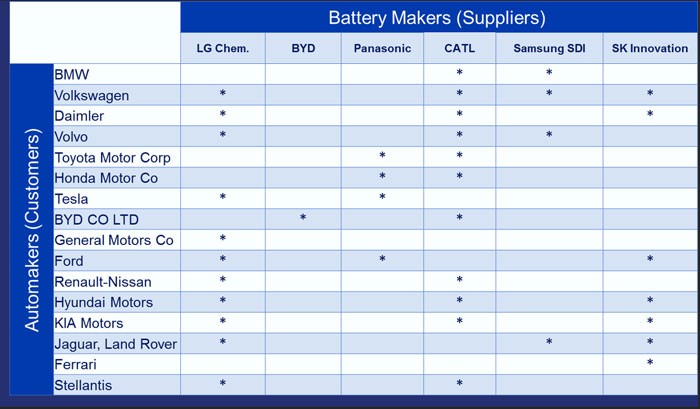
Major car manufacturers also participate in accelerating the development of the battery industry by joint ventures with battery manufacturers (Table 2-2).
Also, startups are developing new ideas to improve and change automotive class battery technology with the investment of major car manufacturers. Ideas that increase the energy density and capacity of the battery and its lifespan much higher and have a positive effect on the navigation and price of the car.
Table 1-2: Table of battery suppliers for major car manufacturers in the world [10].
Innovation in the field of lithium-ion batteries is happening rapidly in various sectors. So that it is expected that in the next 5 years there will be big technological developments in different parts of the battery.
For example, the development of solid-state lithium-ion battery electrolyte technology and lithium-sulfur battery technology can increase the energy density and capacity of the battery up to four times (Figure 3-2). Major automobile companies such as Toyota, Volkswagen, BMW, Nissan, Hyundai, Renault and Mitsubishi are competing on the development of this production technology [11].
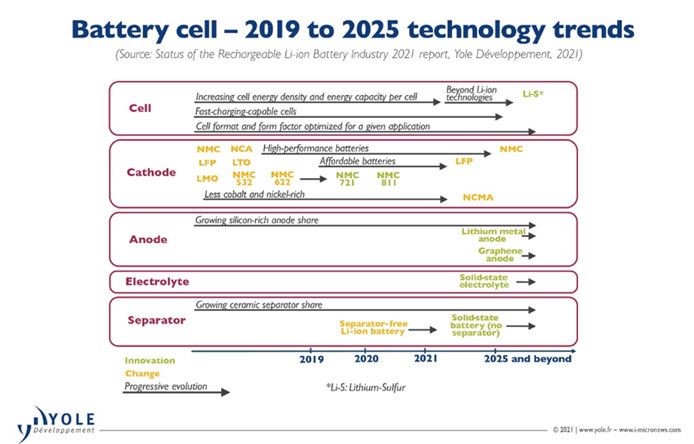
Figure 1-10: The evolution trend of automotive class lithium-ion battery technology in the period from 2019 to 2025
1-4- The prospect of electric vehicles in the world automotive industry
As mentioned before, it is expected that the demand for buying and, accordingly, the amount of sales of new cars in the world will increase until 2040. In addition, investment in new technologies of automotive driving forces is creating changes in the product portfolio of car manufacturers.
This means that with the visible decrease in the price of electric cars and their competitive price in the car market, it is predicted that with the acceptance of electric cars by consumers, the sales of this car will increase in the coming years (Figure 8-1).
Due to the superior features of all-electric cars compared to other types of electric cars, including lower maintenance and repair costs, lower operating costs, less technical complexity, and no CO2 emissions. And To soon Price Inexpensive more, this type From cars electric At the future Close share able They will have the attention of the car sales market.
It is expected that by 2040, the sales share of fully electric cars will reach 70% of the total sales and instead, the share of internal combustion vehicles from the sale of new products will increase from 96% in 2018 to less than 15% in 2040.
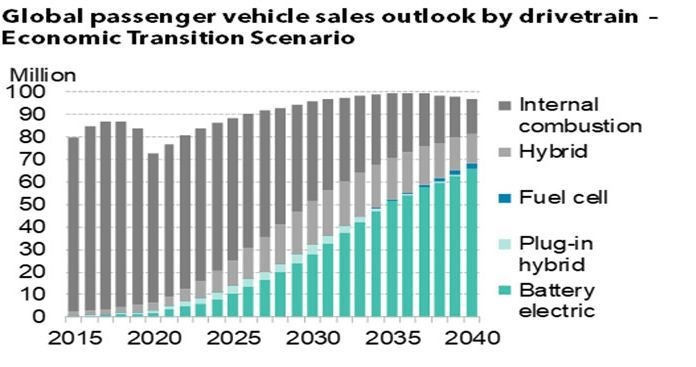
Figure 1-11: Forecasting the amount of global car sales based on types of driving forces [1]
In other words, the traffic of 10 million types of electric cars in the world in 2020 will lead to 600 million all-electric cars in 2040; which includes 40% of all cars in the world.
During this period of time, plug-in hybrid car technologies will be removed from the car market due to the popularization of all-electric cars and the development of electricity supply infrastructure.
2- Laws and government support for electric cars
In recent years, choosing an electric car option has been proposed as a multi-faceted solution to solve environmental, economic and security problems for the countries of the world. Studies show that due to the intense consumption of fossil fuels in recent years, the discovered reserves of this type of fuel will only be sufficient for the next 5 decades.
This limitation in the supply of fossil fuel in the world in the coming years can lead to economic pressure and, as a result, security pressure on the governments. Therefore, it is mandatory for governments to focus on alternative energy sources.
On the other hand, the consumption of fossil fuels has caused severe air pollution in big cities and led to climate changes on the planet in a wider way. In order to prevent these consequences or reduce their severity, it is necessary to use technologies that emit close to zero pollution.
In recent years, with the development of technology and the expansion of emerging markets for electric cars, it is referred to as a solution to the problems caused by the consumption of fossil fuels. In line with the development of the electric car industry and market and increasing the willingness of communities to use electric cars, governments use the implementation of facilitating laws, emission standards and incentive programs.
Governments are trying to limit the use of fossil fuel vehicles by imposing strict laws. For example, they impose more taxes and duties on internal combustion vehicles. In addition, in the field of automobile manufacturing, governments apply strict emission standards along with tax incentives in order to guide automakers to change their product portfolio to electric vehicles.
In the market, they encourage buyers to buy electric cars by applying various incentive packages. The development of the electricity network infrastructure will also facilitate this transformation and move towards the replacement of internal combustion vehicles with electric vehicles.
In Table 2-1, the actions of some countries in the development of the electric vehicle market are presented. In Table 2-2, government incentives for buying electric cars in some countries are presented.
Table 2-1: The table of sovereign support and laws and goals of some countries [12].
Country | Law | Goals | Ambitious goals |
china | From 2025 4.6 L/100km (WLTP) 4.0 L/100km (NEDC) | Reaching 20% share of ZEV cars in total car sales in 2025 | – 70% of passenger cars will be electrified by 2025 (of which 40% will be NEV) |
china | Requiring car manufacturers to allocate credit for car purchase loans with the aim of increasing the share of electric car sales by 12% in 2020 to 18% in 2023 | – | – Sales of 100,000 FCEV vehicles until 2025 |
Japan | From 2030, 3.94 L/100km for passenger cars | By 2030, reaching the sales share of BEV and PHEV 20%-30%, HEV 30%-40% and FCEV 3% | Production, use and sale of pollution-free cars since 2050 |
Canada | Fuel consumption (CAFE): in 2021, 5.55-7.44 L/100km in 2026, 4.93-6.90 L/100km | ZEV cars on the road: by 2025, 825 thousand units, by 2030, 2.7 million units, by 2040, 14 million units | – |
Canada | emissions (CAFE): 246-183 g CO2/mile in 2021, 243-168 g CO2/mile in 2026 | ZEV cars until 2025, 10% until 2030, 30% until 2040, 100% | – |
European Union | From 2020, the permitted emission rate of 95 g CO2/km is considered for new cars. | (ZEV) will be on the road by 2025. | At least 30 million ZEV passenger cars will be on the road by 2030 |
European Union | – In the period from 2021 to 2025, the permitted amount of emission will be limited by 15%. | 15% share of ZEV car sales until 2025 and 35% until 2030 | – |
America | – Requiring automakers to increase credit allocation for electric car purchase loans up to 22% of the total in 2025 | California: 20% reduction in the carbon index of fuel tanks of the transportation fleet by 2030 compared to 2010 | California: By 2035, all new cars will be ZEVs. |
America | Granting purchase subsidies in some states | ZEV vehicles in the road fleet by 2025, 1.5 million and by 2030, 5 million | – |
Table 2-2: Table of incentives for buying electric cars in some countries
Row | Country | purchase subsidy | conditions |
| 1 | Germany | 3,760 Up to 9,000 euros | The price of the car is less than 40,000 euros |
| 2 | France | 1,000 Up to 6,000 euros | The price of the car is less than 45,000 euros and compliance with environmental standards |
| 3 | England | A maximum of £ 2,500 | The price of the car is less than 35,000 pounds and compliance with environmental standards |
| 4 | Spain | 4,000 Up to 7,000 euros | The price of the car is less than 45,000 euros and compliance with environmental standards |
| 5 | Italy | 2,500 Up to 8,000 euros | The price of the car is less than 61,000 euros and scrapping the car with a life of 7 years or more |
| 6 | china | 6,800 Up to 18,000 yuan | The price of the car is less than 300,000 yuan |
| 7 | USA (New Jersey) | 2,000 Up to $ 5,000 | The price of the car is less than 55,000 dollars |
| 8 | Canada | 500 Up to $ 5,000 | In addition to the federal government, the province of Quebec pays $ 8,000 for a qualifying vehicle |
Examining the global trend of government expenditures in the development of the electric car market and the increase in the desire of buyers shows that in the period from 2015 to 2020, governments have spent nearly 70 billion dollars to encourage buyers to buy electric cars (Fig 2-1).
This Kurdish spending includes two parts of providing direct subsidies for car purchases and waiving part of taxes and other sources of government revenue. Also, due to the provision of incentive packages and the application of strict environmental laws and standards, car buyers have spent more than 340 billion dollars to buy electric cars.
As can be seen in Figure 2-1, in the period from 2015 to 2020, the share of direct government subsidies for the purchase of electric cars has decreased from 22% to 10% of the total government expenditure. This issue shows the increase in motivation of car buyers to buy electric cars.
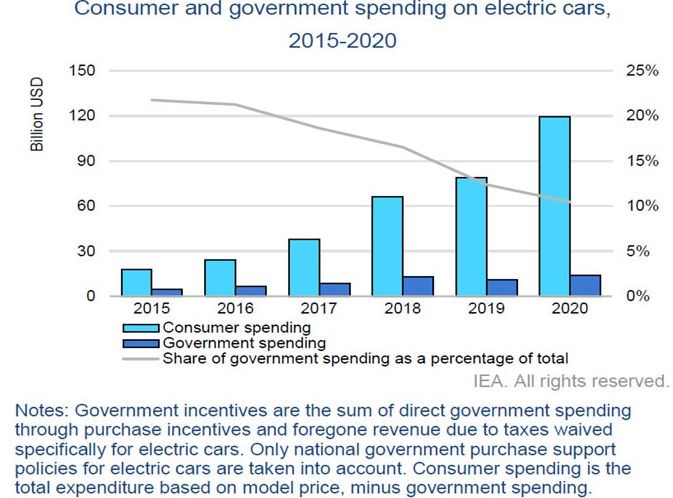
Figure 2-1: Chart of government and consumer expenditures for electric cars in the period from 2015 to 2020 [2].
3- The role of the world's major car manufacturers in the development of the electric car market
In order to be a pioneer in the development and offering of electric cars and to attract a larger share of the sales market of this product, the world’s major car manufacturers have presented various programs.
This program is aimed at providing new models of electric cars, increasing the share of electric cars from the product sales basket, increasing the circulation of electric cars.
Table 3-1 shows the announced electric car production plans by 7 of the world’s largest car manufacturing companies.
Table 3-1: The table of announced programs of major car manufacturers in the field of electric cars [2].
Row | Name of the car maker | Target |
1 | even though | From 2030, only electric cars will be sold in the European market. |
2 | Ford | From 2030, only electric cars will be sold in the European market. |
3 | General Motors | Since 2035, only electric cars are available for sale. |
4 | Volkswagen | By 2030, 70% of the products will be offered in the European market and 50% in each of the Chinese and American markets. |
5 | Toyota | By the beginning of the 2020s, more than 10 new models of electric cars will be introduced. |
6 | Mercedes-Benz | In 2020, the sale of 0.1 million electric cars |
7 | BMW | By 2025, the sales share of electric cars from the product portfolio will reach 15-25%. |
By examining the goals announced by the world’s major car manufacturers in the field of electric products (Figure 3-1), it is estimated that by 2030, a significant share of car manufacturers’ sales in the large markets of China, the United States and the European Union, It will be electric cars.
In addition, car manufacturers are trying to respond to the diverse tastes and demands of their customers by offering new and diverse models of electric cars. In 2020, nearly 360 electric car models were presented by automakers to the big electric car markets.
Of this amount, 200 models of electric cars have been presented to the Chinese market, 110 models to the European Union market, and 50 models to the American market (Figure 3-2).
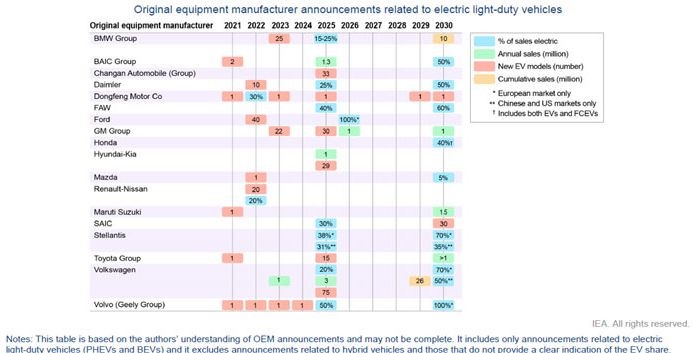
Figure 3-1: Notification programs for the production and sale of electric cars of 18 major car manufacturers in the world
has been presented to the market in the categories of small cars, medium cars, crossovers, large cars and SUVs.
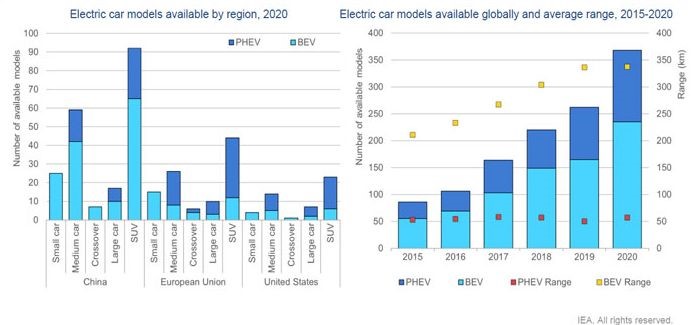
Figure 3-2: Types of classes of electric cars (two all-electric and plug-in hybrid models) offered to the markets of China, the European Union, and the United States in 2020 (chart on the right); The diagram of the number of electric car models presented in the period from 2015 to 2020 and the average diagram of the navigation of electric cars (left diagram) [2].
Among the types of electric car classes offered in 2020, the share of two classes of SUVs and medium cars has been the largest. This year, nearly 160 SUV models have been introduced to the large electric car markets, which has a 45% share.
In explaining the reason for the introduction of this number of models of the SUV class of electric cars, the following can be mentioned:
- In China and European countries, the SUV car market has grown the most in recent years, and in America, the largest share of the car market belongs to SUV cars.
- SUV cars have a higher price and create a higher profit margin for the car manufacturer and that in these cars, the share of electric power in the price of the car is less than that of small electric cars.
- SUV cars are heavier and have more fuel consumption, so electrifying them brings more pollution.
- SUV electric cars are eligible to receive the most incentives (incentive programs based on CO2 emission standards) compared to other electric car models.
Navigation index is one of the most important influencing factors in the eyes of buyers. Thus, compared to the amount of internal combustion vehicles, it is considered a bottleneck for the development of the all-electric vehicle market.
Regarding the survey index of electric vehicles, this index has gone through a growing trend during the years 2015 to 2020. In 2020, the average range of all-electric cars with a full charge is close to 300 km [2].
Sources
[1] Bloomberg NEF, “Electric Vehicle Outlook 2021,” 2021. [Online]. Available: https://about.bnef.com/electric-vehicle-outlook/.
[2] “Global EV Outlook 2021 Accelerating ambitions despite the pandemic,” 2021.
[3] P.Friedlingstein et al., “Global carbon budget 2020,” Earth Syst. Sci. Data, vol. 12, no. 4, pp.3269–3340, 2020.
[4] RK Pachauri and LA Meyer, “Fifth Assessment Report of the Intergovernmental Panel on Climate Change, ed,” RK Pachauri LA Meyer (Geneva, Switz. IPCC, 2014), pp.1–151.
[5] “Paris Agreement.” 2015, [Online]. Available: https://unfccc.int/process-and-meetings/the-paris-agreement/the-paris-agreement.
[6] RA Roehrl, “Sustainable Development Scenarios for Rio+20 A Component of the Sustainable Development in the 21st Century (SD21) project.” New York, 2013.
[7] “Intended Nationally Determined Contribution (INDC) of Islamic Republic of Iran,” 2016. https://www4.unfccc.int/sites/submissions/indc/Submission Pages/submissions.aspx.
[8] H.Ritchie and M.Roser, “Emissions By Sector,” OurWorldInData.org, 2020.
[9] C.Harto, “Electric Vehicle Ownership Costs: Today’s Electric Vehicles Offer Big Savings For Consumers,” 2020.
[10] D. Harrison, “Electric Vehicle Battery Supply Chain Analysis How Battery Demand and Production Are Reshaping the Automotive Industry,” Automotive from Ultima Media, Jun. 2021.
[11] S. Agarwal, “Status of the Rechargeable Li-Ion Battery Industry 2021 report, Market and Technology Report,” 2021. [Online].
Available: https://www.i-micronews.com/products/status-of-the-rechargeable-li-ion-battery-industry-2021/utm_source=PR&utm_medium=email&utm_campaign=PR_STATUS_OF_THE_RECHARGEABLE_BATTERY_INDUSTRY_YOLE_July2021.
[12] International Energy Agency, “Global EV Policy Explorer,” 2021.
0 Comments